Comparative Machine Learning Approaches For Predicting Scale Score Averages (Capstone)
Language - Python, Environment - Jupyter Lab
In my capstone, I aimed to answer this research question - How do traditional regression models compare to tree-based models in predicting school level Scale Score Averages based on predictive accuracy and model performance metrics?
Models used in this study
- Tree-based models: Decision Tree Regressor, XGBoost
- Traditional regression models: Ridge Regression, Lasso Regression
I divided the script/code to three. All of these were done in Jupyter Lab. Language is Python. Click each section below to view the complete code - you will be redirected to an html file.
- Data Preparation and Processing
- Building and hypertuning the machine learning models
- Data analysis which included statistical results, tests, and visuals
Hypertuning Parameters and Statistical Criteria
The four models - Ridge Regression, Lasso Regression, Decision Tree Regressor, and XGBoost - were hypertuned using RandomizedSearchCV with the following configuration: n_iter=10, scoring=’r2’, cv=3, random_state=42, and n_jobs=-1. The following metrics were collected: R² Score, Mean Squared Error (MSE), Root Mean Squared Error (RMSE), Mean Absolute Error (MAE), and Pearson Correlation. Additional diagnostics included mean residual, residual standard deviation, and diagnostic visualizations.
Results and Findings

This table (above) summarizes key evaluation metrics for all four models. XGBoost achieved the highest R² and lowest error values, indicating superior predictive accuracy, followed closely by Decision Tree. Ridge and Lasso performed considerably lower across all metrics.
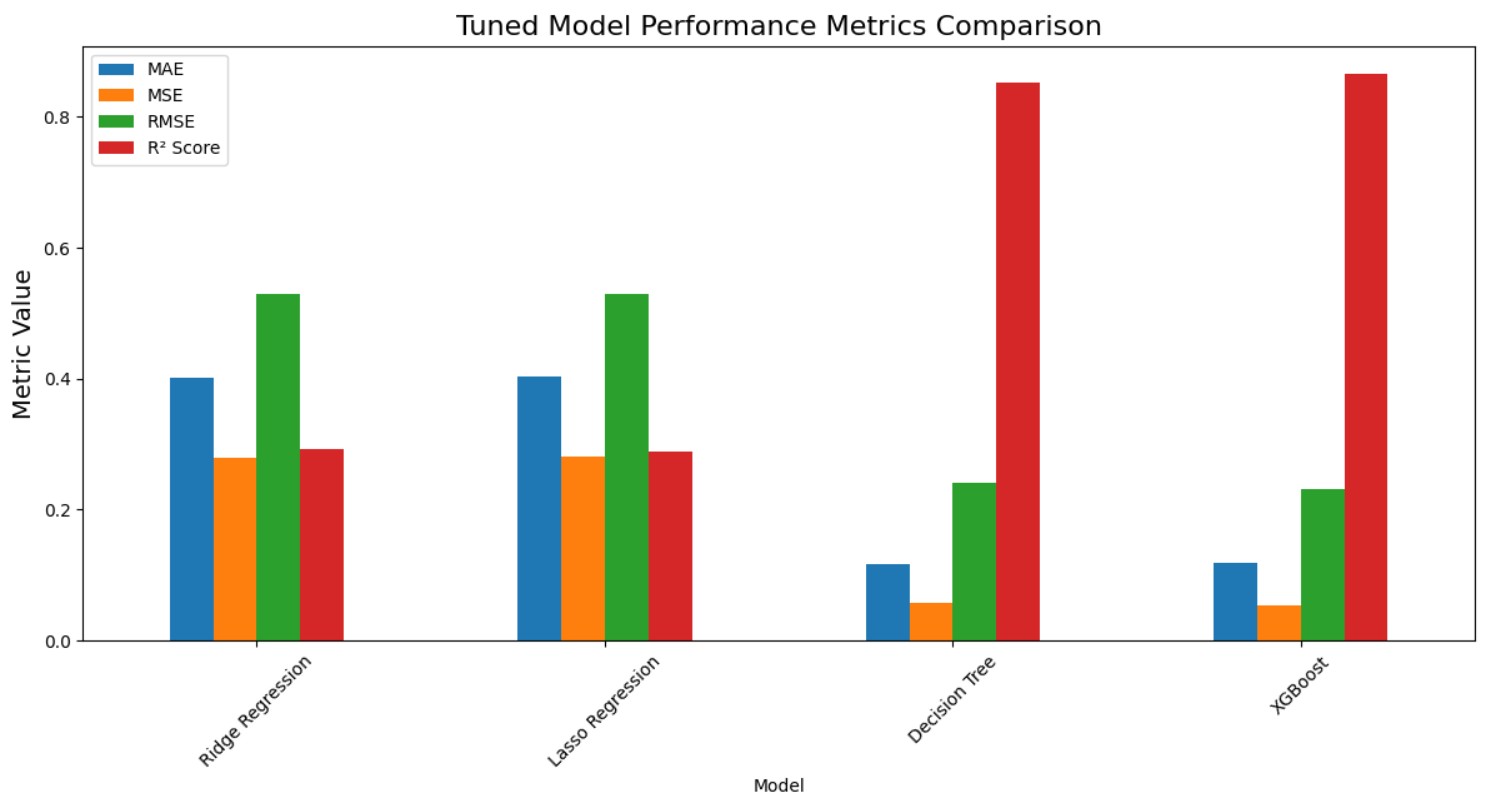
Comparison of Model Evaluation Metrics (MAE, MSE, RMSE, R²) Across All Tuned Models (Above) This bar chart compares all models' MAE, MSE, RMSE, and R². XGBoost outperforms all others with the highest R² and lowest error metrics, followed by Decision Tree. Ridge and Lasso show weaker predictive performance.
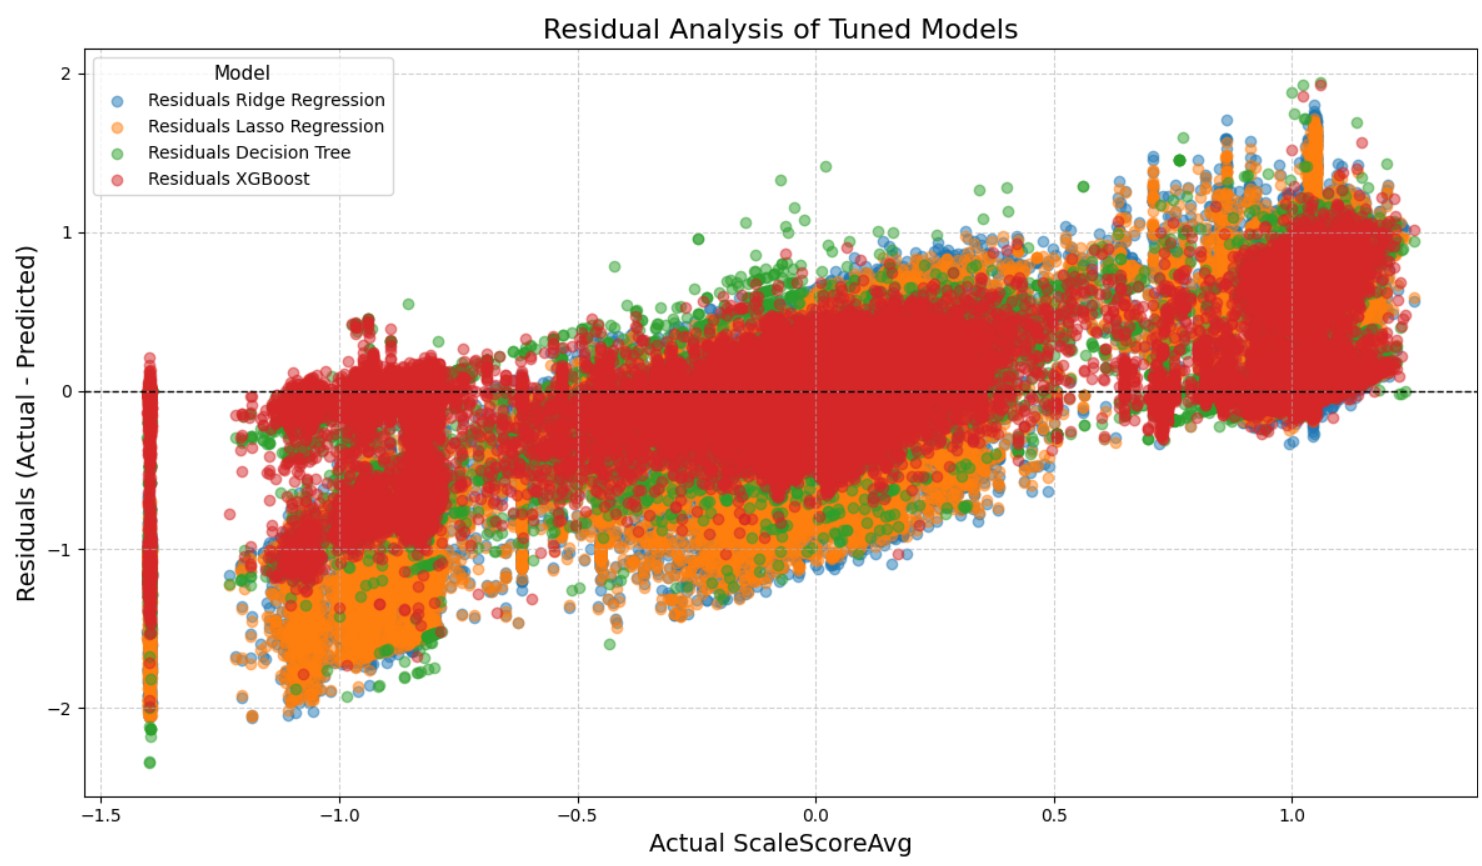
Residual plot comparing the performance of Ridge Regression, Lasso Regression, Decision Tree, and XGBoost models. Residuals are plotted against actual values to assess model accuracy and error distribution.
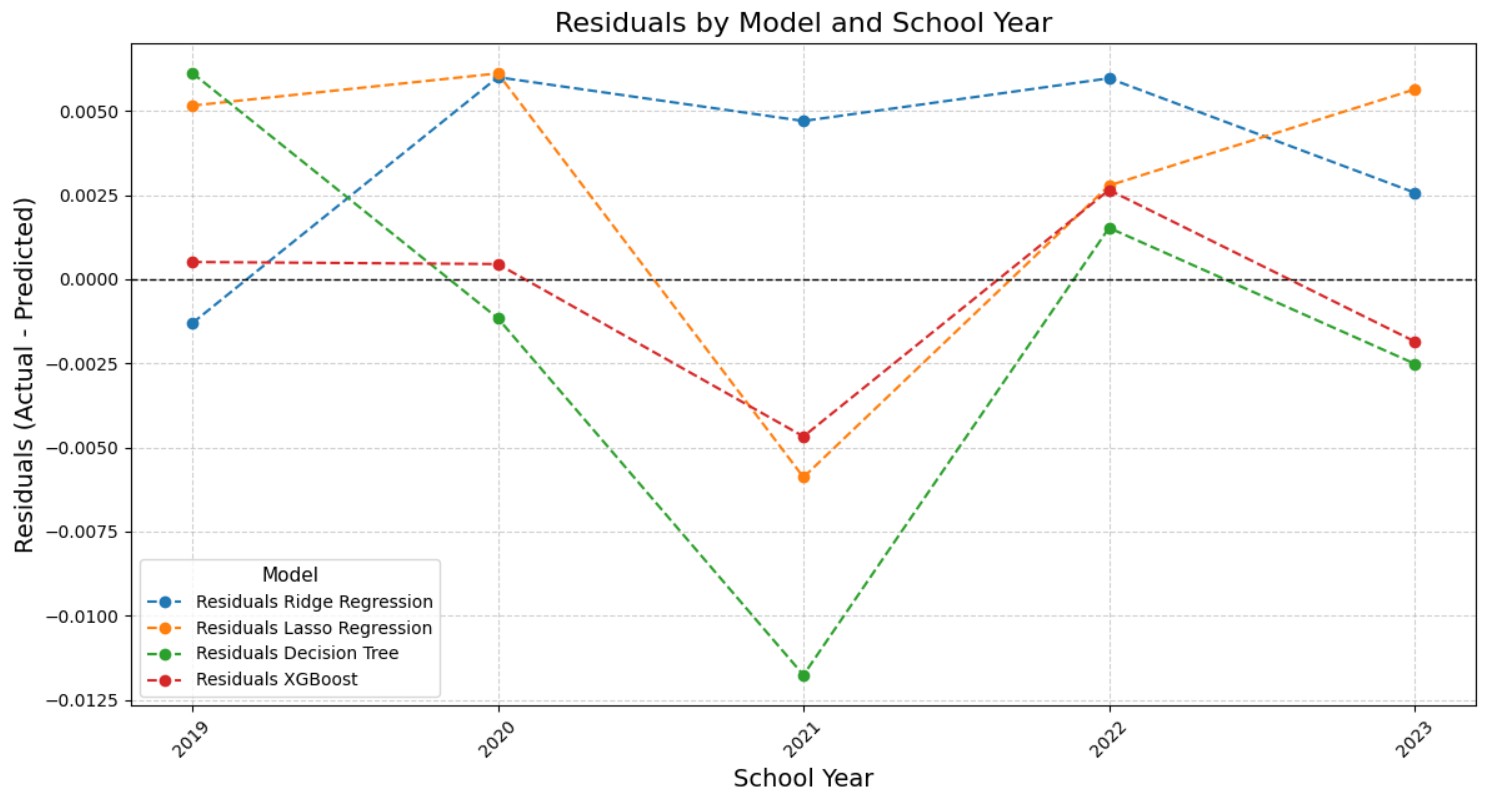
Mean residuals of Ridge Regression, Lasso Regression, Decision Tree, and XGBoost models across school years from 2019 to 2023, highlighting model performance consistency and changes over time.
After evaluating each model individually, a statistical comparison was performed to determine whether predictive accuracy significantly differed between the two model groups: tree-based models (Decision Tree and XGBoost) and traditional regression models (Ridge and Lasso).
Hypothesis
- Null Hypothesis (H₀): There is no significant difference in predictive accuracy between tree based models and traditional regression models in predicting school-level Scale Score Averages.
- Alternative Hypothesis (H₁): Tree-based models demonstrate significantly higher predictive accuracy than traditional regression models in predicting school-level Scale Score Averages.
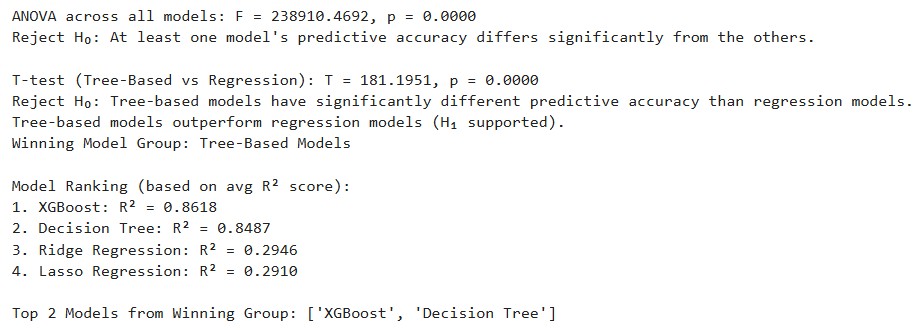
A two-sample independent t-test was conducted using the average cross-validated R² scores of the models in each group. The alpha value was set at 0.05. Additionally, a one-way ANOVA test was used across models to support the t-test results and to rank each model based on average R² Score. Along with these statistical results, I generated several visualizations to support my findings.
As shown in the attached summary (figure below), the mean cross-validated R² scores for tree-based models were 0.8487 (Decision Tree) and 0.8618 (XGBoost), while regression models achieved 0.2946 (Ridge) and 0.2910 (Lasso). The t-test comparing these group means produced a t-statistic of 181.20 and a p-value of 0.0000, leading to the rejection of the null hypothesis. A one-way ANOVA was also performed across all four models to reinforce this result. The ANOVA returned an F-statistic of 238910.47 with a p-value of 0.0000, confirming statistically significant differences in predictive accuracy among the models.
Additional visual diagnostics were used to support the statistical findings. The bar charts below comparing MAE, MSE, RMSE, and R² clearly illustrates the superior performance of the treebased models. Furthermore, residual histograms and scatter plots showed that the regression models produced more spread-out residuals, while the tree-based models yielded tighter and more symmetric error distributions.
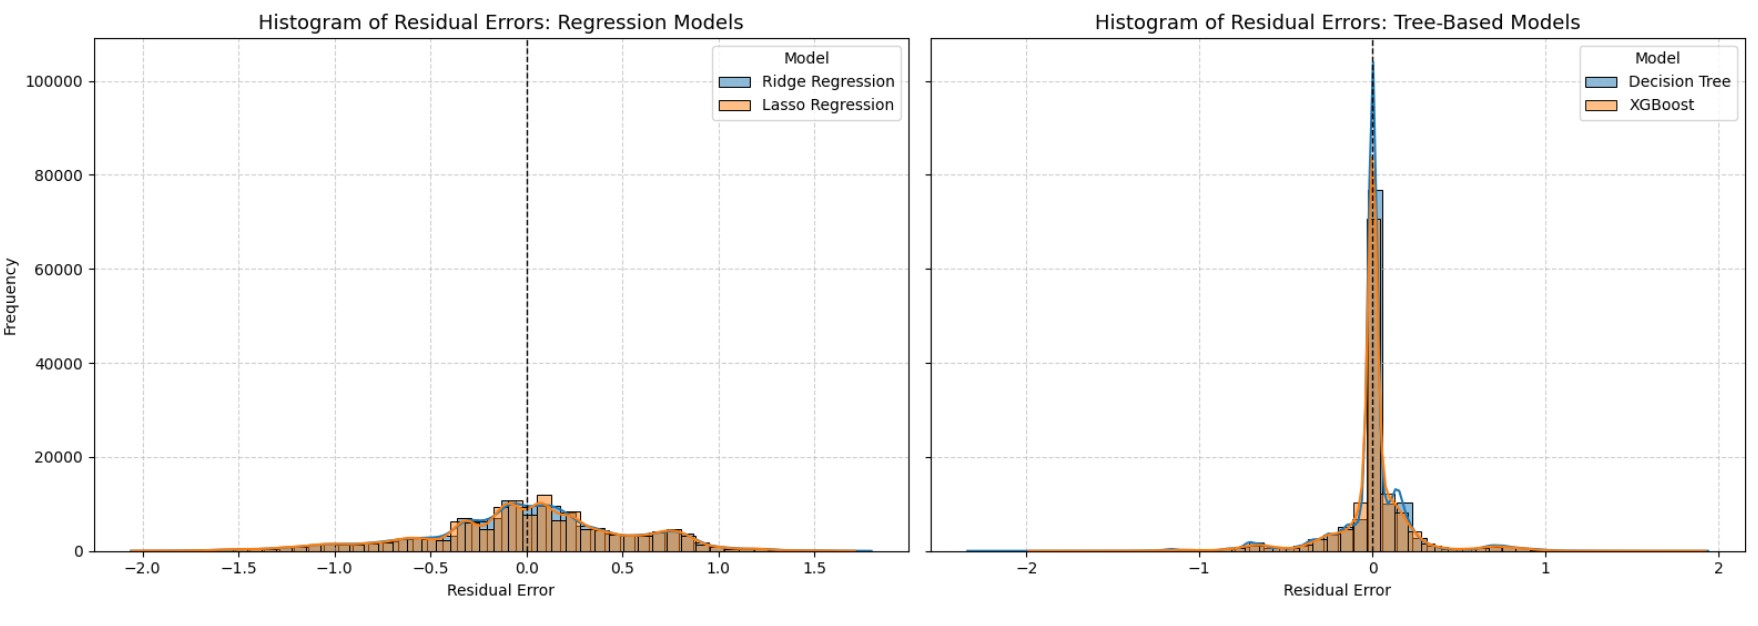
Histogram of Residual Errors – Regression vs. Tree-Based Models (above) This side-by-side histogram compares residual error distributions. Tree-based models (right) show tighter, more centralized residuals around zero, indicating higher accuracy and consistency than regression models (left), which display wider, more dispersed error patterns.
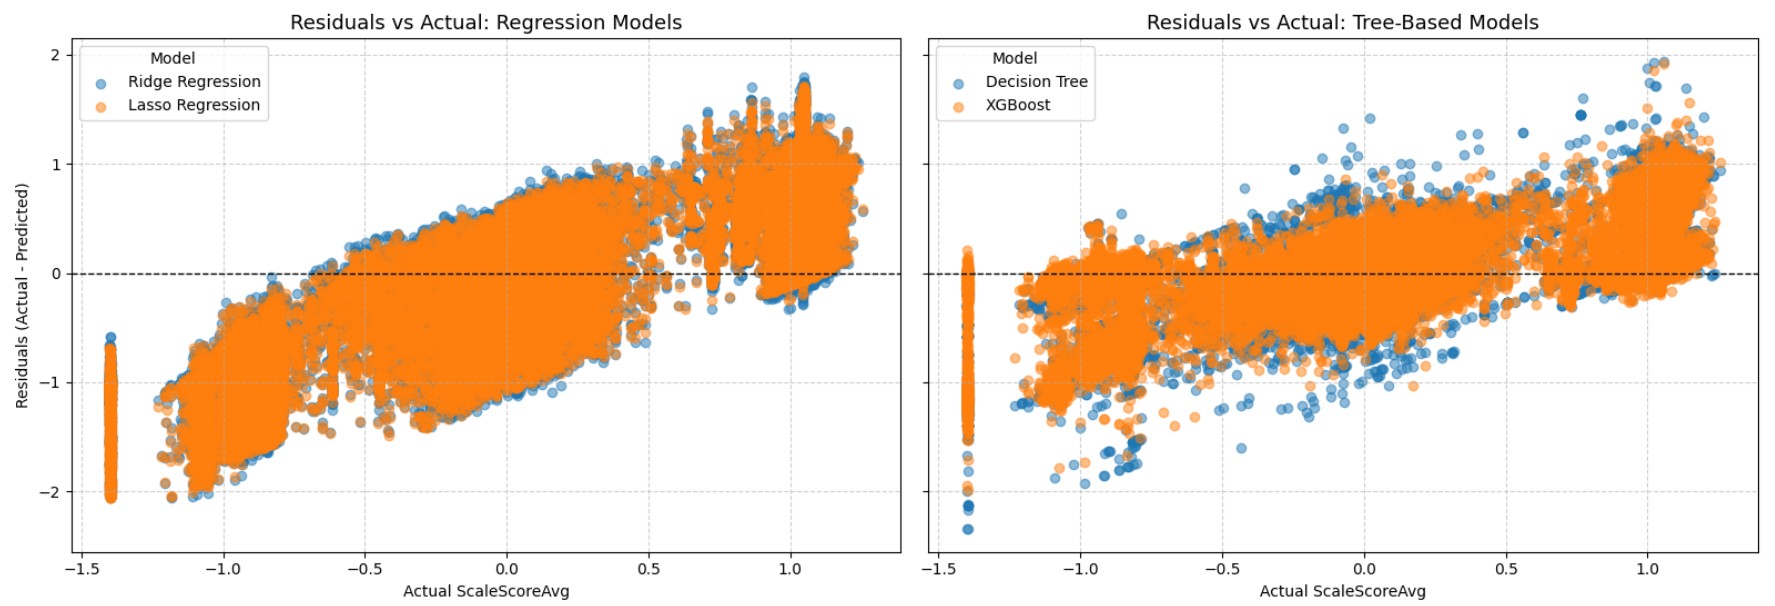
Residuals vs. Actual Values – Regression vs. Tree-Based Models (above) This visual compares the residuals (actual minus predicted values) against actual ScaleScoreAvg scores. Tree-based models (right) show more centralized and tighter residuals around zero, indicating more accurate and consistent predictions. Regression models (left) display wider dispersion and more significant error variability across the score range.
Feature diagnostics also supported this conclusion. This suggests that tree-based models are more accurate and suitable for modeling complex relationships in school-level performance data.
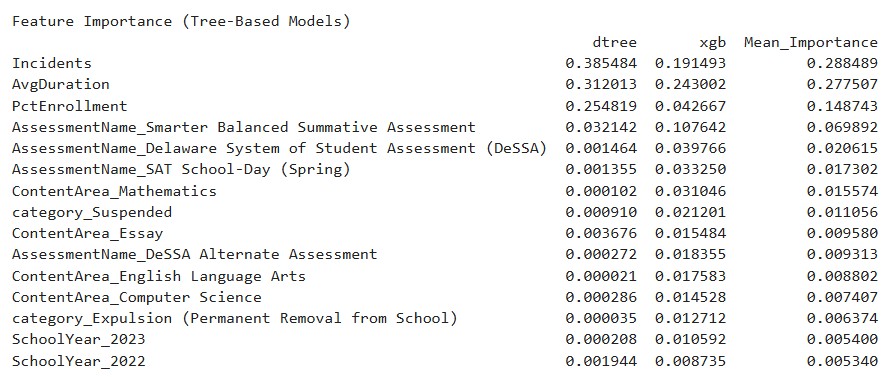
Feature Importance Scores from Tree-Based Models (above) This table presents the top predictors ranked by average importance across the Decision Tree and XGBoost models. Incidents, AvgDuration, and PctEnrollment, emerged as the most influential features driving school-level academic outcomes
Based on these comprehensive statistical results and visual evaluation, there is sufficient evidence to reject the null hypothesis — that tree-based and traditional regression models do not differ significantly in predictive accuracy for school-level scale score averages — and to conclude that tree-based models significantly outperform traditional regression models in this task.